
At several air-quality monitoring stations across Delhi, something unusual happened on the night of 8 November. As Diwali celebrations continued and fine-particle pollution climbed towards 1,000 micrograms per cubic metre, critical readings began disappearing from the public data stream. Some stations stopped just below that level. Yet instruments measuring gaseous pollutants at many of the same locations continued transmitting. The stations had not simply vanished from the network. The public record of the most dangerous particulate pollution had become incomplete. 1
A Hindustan Times analysis of Central Pollution Control Board records, published on 9 November, found that 148 of 351 expected hourly PM2.5 observations were absent from 39 longstanding stations in the overnight reporting window. That is approximately 42%, compared with around 3.9% on ordinary nights before Diwali. Across the wider network, 43 of 59 stations had at least one missing PM2.5 observation. The newspaper also reported that at 1 am, just 13 of the 39 longstanding stations supplied PM2.5 data while 38 supplied nitrogen dioxide data. 1
This happened during a politically charged pollution episode. The BJP-led Delhi government had defended a recent expansion of the monitoring network. The Aam Aadmi Party alleged interference with pollution stations; Congress questioned the missing observations. The evidence of data gaps, however, raises a question larger than the competing accusations: can a public index reliably describe a crisis when crucial observations disappear near the peak?
The available reporting documents serious monitoring gaps. It does not establish that Delhi's government deliberately caused them or falsified the readings. Establishing the difference between an instrumentation failure, a flawed averaging method and intentional interference is essential to the investigation.
The night the monitors went silent
PM2.5 refers to particles no larger than 2.5 micrometres in diameter. Their concentration is measured in micrograms per cubic metre of air, while the Air Quality Index converts pollutant concentrations into a standardised index using specified averaging periods. A PM2.5 concentration of 1,000 µg/m³ is not an AQI reading of 1,000. Conflating the two makes a hazardous situation harder to understand rather than easier.
Among the stations examined by Hindustan Times, North Campus recorded a sharp increase from 326 µg/m³ at 8 pm to 999 µg/m³ at 10 pm before the readings disappeared. CRRI Mathura Road and ITO also recorded concentrations approaching 1,000 µg/m³ before reporting gaps. The continued transmission of gases at many affected sites makes a simple explanation based on total power loss inadequate. It raises the possibility of a measurement-range limit, data-processing issue, equipment saturation or some other problem specific to particulate readings. The cause was not established in the records available to the newspaper. 1
Separate reporting by The Indian Express found that 45 of Delhi's 59 stations had at least one missing hourly observation for one or more pollutants during Diwali day. The gaps were not confined to PM2.5: sulphur dioxide, ammonia and PM10 also had incomplete records. Lodhi Road, operated by the Indian Institute of Tropical Meteorology, had 96 of 192 expected hourly observations missing across eight monitored parameters. Those counts cover a wider set of pollutants and a different reporting period from the overnight PM2.5 analysis, and must not be combined as if they measured precisely the same thing. 2
Manoj Kumar, a pollution analyst at the Centre for Research on Energy and Clean Air, warned in comments reported by The Indian Express that missing observations close to an instrument's upper measuring range should not automatically be treated as ordinary missing values. Their exclusion can underestimate pollution when the missing periods coincide with the highest concentrations. That is a statistical concern independent of any accusation about political interference. 2
There is a material difference between a monitor failing at random and one failing disproportionately when pollution is most severe. An ordinary average of the observations that survive may look less extreme if the highest measurements are missing. In an illustrative calculation, Hindustan Times estimated a 24-hour index of 437 for its group of 39 stations using recorded observations, and 471 after estimating missing hours from surrounding values. The 34-point difference is the newspaper's reconstruction, not an official CPCB correction. It should not be compared directly with a citywide bulletin calculated from a different station set. 1
To establish what actually happened, an independent audit would need instrument specifications, raw data logs, data-validation rules and station-by-station explanations for the interrupted periods. Without those materials, it is possible to identify a suspicious pattern without proving its mechanism or cause.
The stations that changed the average
Delhi's monitoring system was already under scrutiny before the festival. On 13 October, the authorities inaugurated 13 new Continuous Ambient Air Quality Monitoring Stations, extending the network from 47 to 60. The government described the expansion as a way to fill geographical gaps and strengthen pollution surveillance. The launch is confirmed by the Union environment ministry's public record. 3
But where stations are located can materially affect an aggregate reading. In its 7 November analysis, Hindustan Times found that the 13 newer stations, many situated on Delhi's periphery, reported PM2.5 concentrations around 35% lower than nearby longstanding stations. It calculated that the official 4 pm citywide AQI of 382 on 6 November would have been 393 without the newly introduced stations. At some earlier hours, the same comparison crossed the threshold from 'very poor' into 'severe'. 4
That discrepancy is significant, but it is not proof of rigging. New stations may capture genuinely cleaner areas which were previously poorly represented; leaving those areas out might also produce an unbalanced citywide picture. A senior government official told the newspaper that the locations followed the Commission for Air Quality Management's regional coverage plan and were not chosen to manipulate the index. That explanation deserves to be assessed against the original station-location criteria, local population and land-use characteristics, rather than accepted or dismissed on partisan grounds. 4
A network changing from 47 to 60 locations changes the set of measurements entering its average. When stations are added in areas with systematically different pollution levels, changes in the reported citywide figure can reflect both genuine changes in the air and a change in the monitoring network. Publishing a consistent comparison using the same long-running stations, alongside the expanded-network figure, would let readers and researchers distinguish those effects.
There is an additional question about what the citywide number is meant to represent. A simple geographical average is not identical to a population-weighted exposure measure. A monitor beside a busy junction and another in a peripheral residential area may both be valid, yet the way their data is combined determines what the index can reasonably tell residents. None of this requires removing legitimate stations; it requires documenting the methodology and its limitations.
The allegations and what they do not prove
On 4 November, AAP's Delhi unit president Saurabh Bharadwaj formally complained to the Commission for Air Quality Management, alleging that water was being sprayed near air-monitoring stations to suppress reported readings. The complaint cited circulating videos and asked for an investigation. The allegation was reported by The Tribune. The videos, as described in the reports reviewed, do not independently establish who directed any spraying, whether it entered a monitor's sampling area, what effect it had on the instrument or whether dust-control work was being deliberately misused. 5
On 9 November, Bharadwaj renewed the accusations on X. The complaint sits alongside legitimate questions about monitoring reliability, but it should not be conflated with the instrument failures documented by reporters. Water spraying is also a recognised dust-suppression practice; determining whether it interfered with a monitor requires dates, locations, operational logs, sensor details and contemporaneous measurements. A video alone is not a completed technical investigation.
Congress leader Ajay Maken raised a separate issue on 9 November. Citing CPCB observations, he said 25 of 39 longstanding stations were not reporting PM2.5 in the 2–3 am period, while nine comparable stations registered an average of 576 µg/m³. He described that concentration as 38.4 times the World Health Organization guideline. His statement and calculation were reported by The New Indian Express. 6
The comparison needs an explicit qualification. WHO's 2021 guideline of 15 µg/m³ for PM2.5 is a 24-hour average; Maken compared an hourly concentration against that benchmark. The ratio conveys that the hourly measurement was extraordinarily high but is not a like-for-like comparison of two daily averages. Similarly, claims that Delhi's Indian AQI exceeded 3,000 cannot be read as CPCB National AQI measurements, whose published scale runs to 500. Some private services apply different scales or algorithms. 7
Delhi minister Kapil Mishra, asked about missing station readings at a 9 November press conference, requested details of reportedly non-functioning monitors and said he would seek action, according to The New Indian Express. That response does not resolve the documented failures, but it is relevant to the government's position. The authorities responsible for the instruments should be given the opportunity to provide a technical explanation and evidence supporting it. 12
What people are seeing
Residents' scepticism is not confined to formal opposition statements. In a September discussion on Reddit's r/delhi forum about worsening air, one user wrote: Time to spray water on the AQI Monitoring centres soon. Stay tuned.
The remark was sarcastic, not authenticated evidence of an actual incident, but it illustrates how doubts about monitoring integrity existed before this Diwali. Online posts cannot replace original measurements or a representative survey; they are evidence of public sentiment and allegations, not proof that a specific event occurred. 8
A separate ground check by India Today–Aaj Tak on Diwali night found public information displays switched off or unavailable at two monitoring locations. The next morning, a digital screen outside the India Meteorological Department's office displayed an AQI of 143, categorised as moderate, while the CPCB dashboard showed roughly 343 for Lodhi Road. The displayed figures were about 200 points apart, but the underlying station, update time and averaging period for the first screen could not be established. The discrepancy therefore cannot, by itself, show that either measurement was fabricated. 9
The reporting team also observed a very high short-term PM2.5 reading at a Dwarka monitoring location while online AQI values showed a different figure. That comparison underscores another frequent source of confusion: short-term particulate concentration and a published, time-averaged AQI are different products. A station can be collecting data even when its public display is unavailable, and an online dashboard can lag behind a local sensor. A trustworthy system should communicate these distinctions rather than leave residents guessing.
When public data informs public decisions
The quality of Delhi's monitoring data matters beyond the display on a phone. The Commission for Air Quality Management invoked Stage III of the Graded Response Action Plan on 6 November, before the disputed Diwali-night readings. Its official dashboard indicated Stage III was in force. Authorities use observations and forecasts to judge when escalating restrictions and public-health precautions are warranted. Missing peak-period values may complicate the assessment of how severe a pollution episode was and whether interventions are working, even where protective measures have already been introduced. 10 11
An incomplete record also makes retrospective accountability difficult. If the most extreme hours are absent from a daily series, public agencies may struggle to determine the peak exposure, compare one festival with another or evaluate emergency responses. A technical report should explain whether affected hours were excluded, flagged as over-range, estimated or treated in another way; it should also specify the standards by which each instrument's data were accepted or rejected.
Such an inquiry need not presume criminal wrongdoing. It should establish the measurement limits at affected stations, whether those limits changed in 2026, which operators were responsible, and whether the raw instruments recorded values that failed to reach the public data feed. The 13 newer stations should be assessed for siting, calibration and statistical treatment, with a fixed-station comparison made available for historical trends. The spraying allegations require separate verification through dated footage, municipal activity records, instructions to contractors and matching sensor readings.
The larger pollution crisis remains undeniable. Vehicle emissions, industrial activity, construction dust, waste burning, regional agricultural fires and winter meteorology all affect Delhi's air. Fireworks can drive short, intense increases in particulate concentrations on top of that background. Accurate measurement cannot substitute for pollution reduction, but without reliable measurement neither residents nor institutions can know precisely what is improving and what is not.
The government's case for expanding its monitoring network is legitimate. Instruments can also fail under extreme conditions without anyone deliberately intervening. Yet serious unexplained gaps at precisely the hours when pollution becomes most dangerous deserve an answer supported by logs, methods and reproducible data—not only political statements or public reassurance.
Delhi does not need its air-quality index to confirm every person's impression of the smog outside. It needs an index that can be independently checked, technically explained and trusted when conditions are at their worst. Until the missing observations are accounted for, the question is not whether manipulation has been proved. It is why the public record is incomplete, and whether the agencies responsible can explain it.
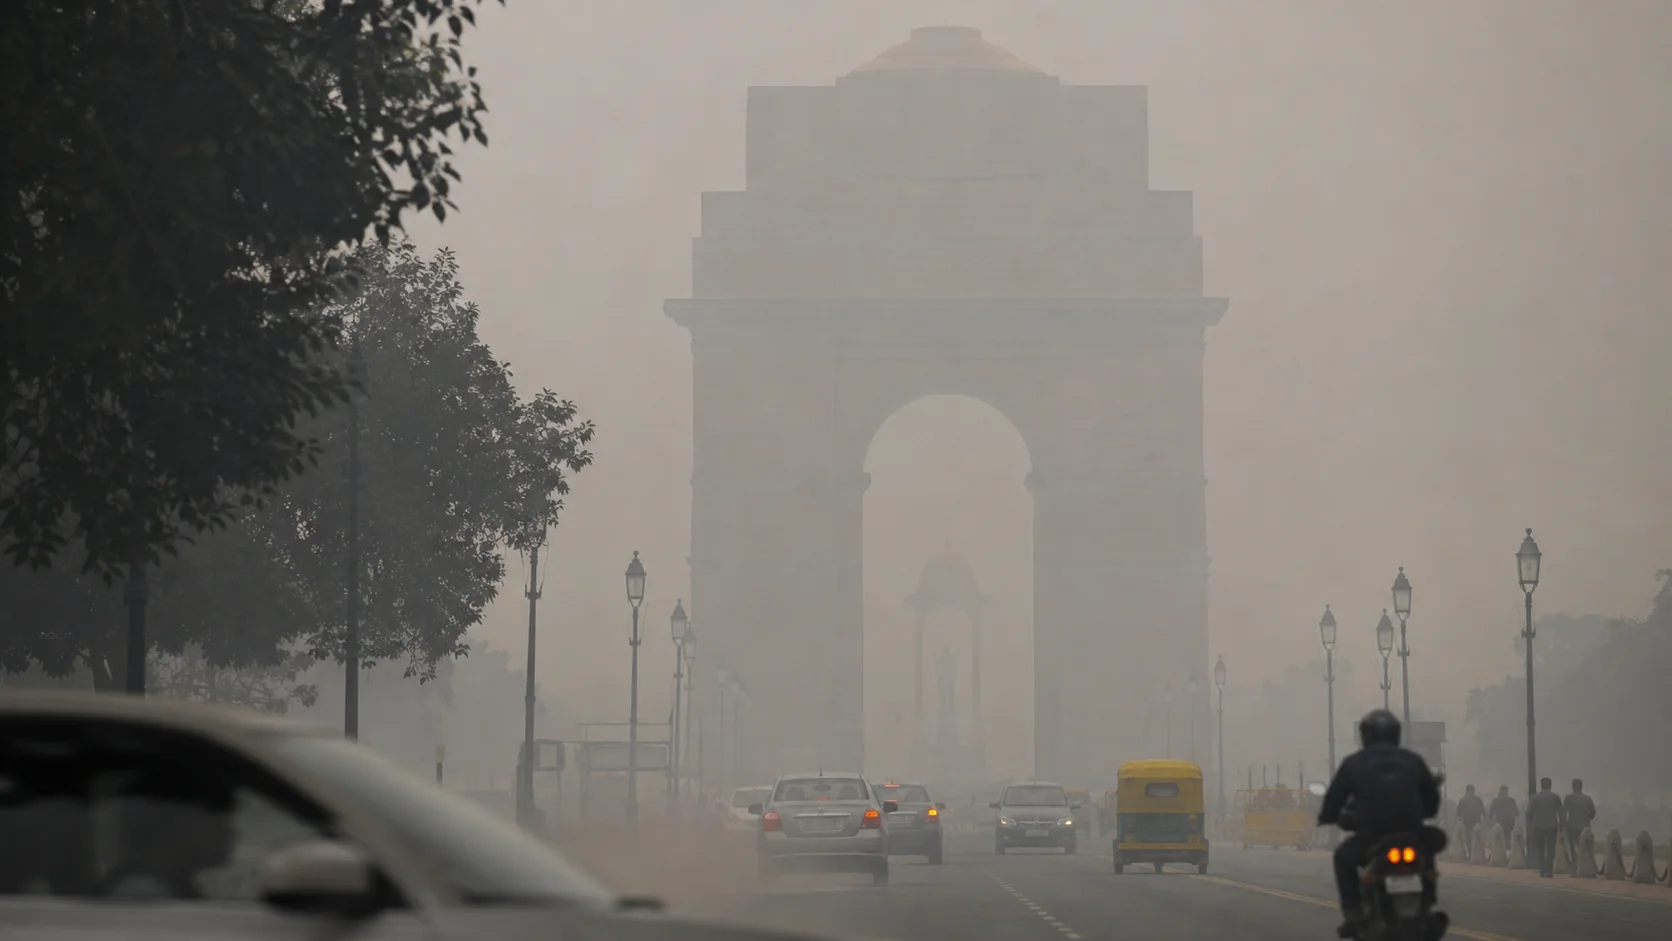
Reporting and verification note: This analysis draws on published station-level reporting by Hindustan Times and The Indian Express, official government material, India Today field observations, public political statements and a verified Reddit discussion. The Raisina Post has not independently downloaded and recalculated CPCB's complete raw station archive, obtained unpublished instrument logs, verified the water-spraying videos or established deliberate interference. The selected India Gate cover is an AI-generated editorial illustration, not a documentary photograph of Diwali night.